Information about grain markets and info to help producers to market crops. See how various grain marketing strategies can effect ones average price. We will be posting various potential trade and option strategies along with marketing decisions made on our mock farms. Now helping daily market minute in empowering farmers to fight big ag and become price makers. Education to help farmers manage crop risk such as corn, soybean, and wheat prices. Using futures, options, basis contracts etc.
Showing posts with label CBOT Wheat Chart. Show all posts
Thursday, June 13, 2013
Wheat Charts 6-13-2013
Labels:
CBOT Wheat Chart,
KC Wheat Chart,
MPLS Wheat Chart
Wednesday, March 13, 2013
Tuesday, May 22, 2012
July CBOT Wheat Chart and July CBOT Corn Chart
Here are couple of charts with the futures prices for corn and CBOT wheat.
Shows the next couple of days could be important for wheat. The corn chart shows us that despite today's nearly limit down move we have simply went back to the bottom end of the range we have had for several months. It could get really scary if we don't hold the support.
Labels:
CBOT Wheat Chart,
charts,
corn prices,
July corn charts
Thursday, July 7, 2011
charts for grains on July 7th
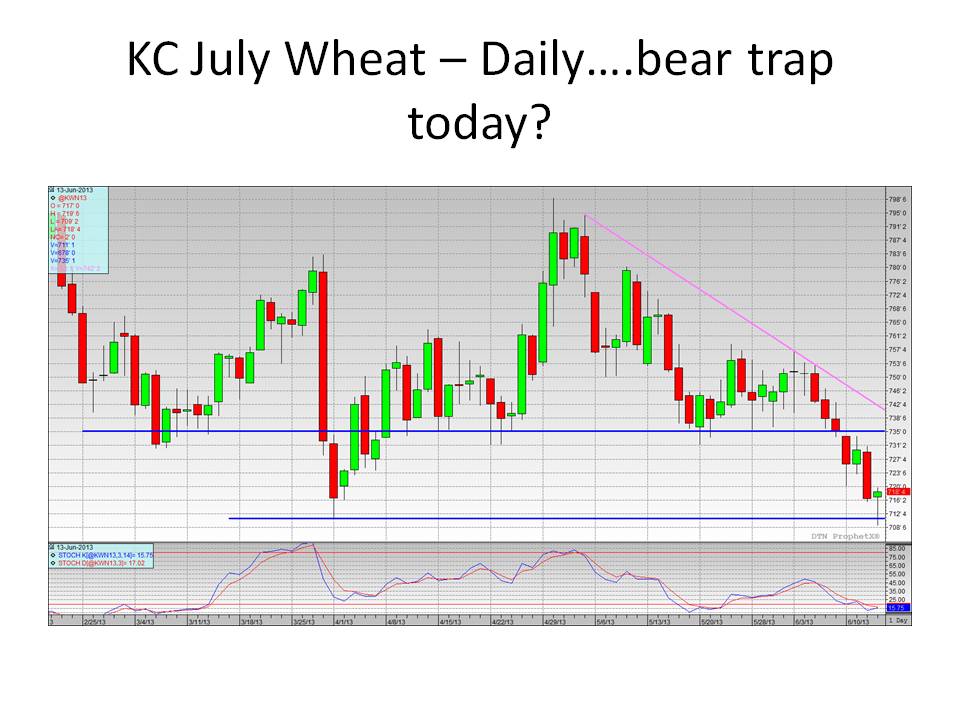
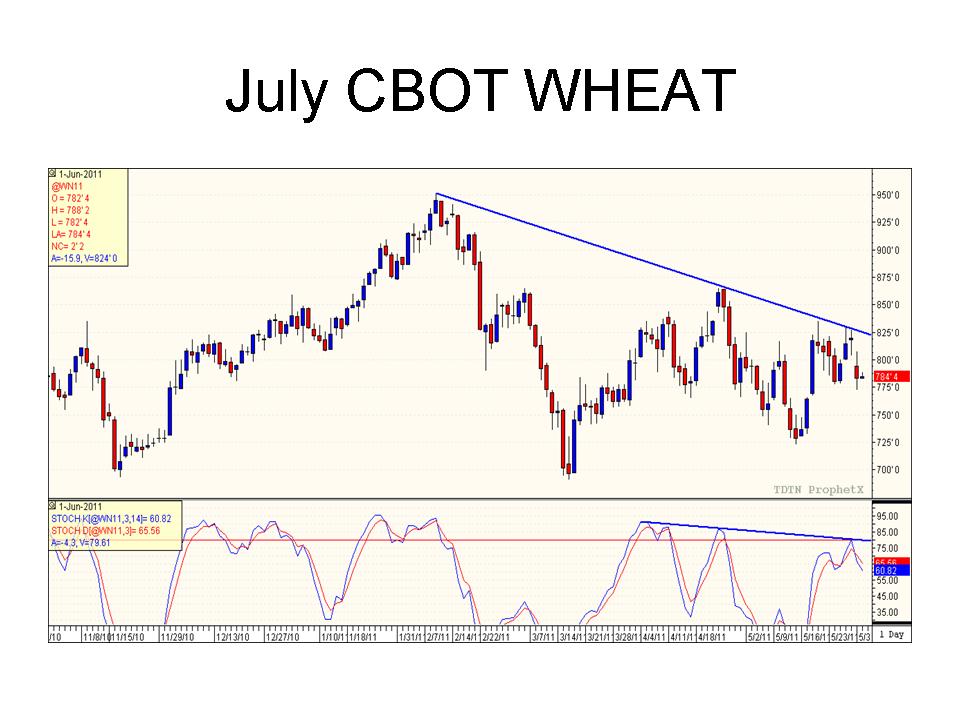
here are some charts for the grain markets for July
Will next week's USDA report be the catalyst that moves the markets down even another leg? Or will it be another shocker that fuels the bulls and lets our bull market keep running. Perhaps next week's weather forecasts, along with the outside markets, and the coming USDA report set price direction for the next several months. Do the seasonals and the rule of not holding unpriced corn past July hold true this year once again or do we see the markets end up repeating last years strength during the time of the year when it is least expected.
Bottom line is the markets appear to have plenty of risk's for both up or down price direction; don't be afraid to have some sort of plan to diversfiy that risk.
Labels:
CBOT Wheat Chart,
charts,
Dec corn charts,
July corn charts,
MPLS Wheat
Tuesday, June 14, 2011
The Commodity Price Sky is falling........or is it just another natural correction in a bull market for grains?
Below are some charts to help you decide if today's price action was natural in nature, maybe a "head fake to scare producers into sales" or if the tide has turned. My personal opinion is that it is a correction but if we follow up the weakness much more threw these support levels I think I will be jumping on the boat that the rally is over. My thoughts for some time have been to simply manage risk and try not to pick a top; but if I have to pick a top I think it happens a little closer to the June 30th report; much like it did in 2008 and simliar to how the lows where made last year on June 29th.
Make sure you take the my opinion for what you paid for it.
Here are a few charts showing some various support levels and thoughts on where we might be heading from here.
Saturday, June 11, 2011
Charts with 2008 comparison to now as well as other charts of wheat and corn
Tuesday, May 31, 2011
But Everyone already knew! So why was Wheat price down so hard today?
But everyone already knew that Russia was going to have a better crop then a year ago and everyone already knew that they where going to be back into the export market.
That was the cry the bull's had today as our markets got smack on what was suppose to be news that really wasn't a suprise. So why did our markets get smacked so hard today?
Maybe the charts below will shed a little light on it; maybe they will just make one wonder even more? The one thing that is clear is that technically the CBOT wheat's price action as well as KC price action really left some clues last week in the form of near doji's left on the charts as well as failures at resistance levels. The MPLS chart below isn't as clear and to me looks a little more freindly then it's wheat sister's in CBOT and KC.
Subscribe to:
Posts (Atom)