Thursday, March 31, 2011
USDA Shocker! Small Corn stocks Super Bullish? Or in the end Bearish?
Corn trades today up 60 cents or so synthetically..........as the USDA had corn stocks a couple hundred million bushels below trade estimates............8.00 corn here we come!
The bad thing on the report was 92.2 million corn acres................my personal perdication is we see 8.00 corn on the board before April 8th crop report............I did also joke with co-workers that will see the corn high made April 7th - April 11th; basically day ahead or day after that report............
I guess only time will tell but today's report should leave producers feel rather good; I would caution that everything always looks the best at the top.
The big thing I think happens is we now curve demand for corn and ECON 101 rules out........my off the wall prediction is we see prices take out the 2008 highs for corn; on a percentage basis I would say that it is 50/50.............but I also think that because of those high prices our demand ends up getting crushed at some point and we see values that start with a 4 on the board at some point before Dec corn goes off the board. I also think the inverse is something to be watching.
Today's report showed 92 plus on corn acres; if you take 4 million acres over last year and assume our high prices don't do anything to demand and it is steady year over year 4 million acres at 150 bushels adds 600 million bushels to the carryout. Personally I think there is very little chance that the actual acres don't increase just because of the insurance levels and prices for corn; so if we end up at 94 million acres now you have a risk of seeing nearly a billion bushels more in production; what happens if we see corn yield come 10 % above trend line instead of 10 % below?
As always only time will tell and it really is up to mother nature right now; but today's price action that and fundamental news is bullish; but I personally view it as bearish new crop corn; I think the sky might be the limit on old crop; but the higher it does end up going and the more end users that say enough is a enough the lower it goes later!
None of the above statements are tended to make any recommendation and keep in mind that futures and options are risky and not for everyone.
Here is some of the info from today's reports
Below are some charts to watch.


The bad thing on the report was 92.2 million corn acres................my personal perdication is we see 8.00 corn on the board before April 8th crop report............I did also joke with co-workers that will see the corn high made April 7th - April 11th; basically day ahead or day after that report............
I guess only time will tell but today's report should leave producers feel rather good; I would caution that everything always looks the best at the top.
The big thing I think happens is we now curve demand for corn and ECON 101 rules out........my off the wall prediction is we see prices take out the 2008 highs for corn; on a percentage basis I would say that it is 50/50.............but I also think that because of those high prices our demand ends up getting crushed at some point and we see values that start with a 4 on the board at some point before Dec corn goes off the board. I also think the inverse is something to be watching.
Today's report showed 92 plus on corn acres; if you take 4 million acres over last year and assume our high prices don't do anything to demand and it is steady year over year 4 million acres at 150 bushels adds 600 million bushels to the carryout. Personally I think there is very little chance that the actual acres don't increase just because of the insurance levels and prices for corn; so if we end up at 94 million acres now you have a risk of seeing nearly a billion bushels more in production; what happens if we see corn yield come 10 % above trend line instead of 10 % below?
As always only time will tell and it really is up to mother nature right now; but today's price action that and fundamental news is bullish; but I personally view it as bearish new crop corn; I think the sky might be the limit on old crop; but the higher it does end up going and the more end users that say enough is a enough the lower it goes later!
None of the above statements are tended to make any recommendation and keep in mind that futures and options are risky and not for everyone.
Here is some of the info from today's reports
1 March 2011 Stocks
USDA
|
Average Guess
|
Range
|
Last year
| |
Corn
|
6523
|
6701
|
6552/6800
|
7694
|
Soybeans
|
1249
|
1295
|
1266/1366
|
1270
|
Wheat
|
1426
|
1399
|
1285/1488
|
1356
|
March 2011 Planting Intentions
USDA
|
Average Guess
|
Range
|
Last year
| |
Corn
|
92.2
|
91.662
|
90.4/92.6
|
88.192
|
Soybeans
|
76.6
|
76.969
|
75.0/78.5
|
77.404
|
Other Spring WHT
|
14.4
|
13.710
|
13.0/14.3
|
13.698
|
Durum
|
2.365
|
2.552
|
2.4/2.8
|
2.570
|
All Winter WHT
|
41.229
|
41.150
|
40.5/42.9
|
37.355
|
Below are some charts to watch.


Wednesday, March 30, 2011
closing grain market comments ahead of the USDA Crop Report for March 31st - Acre and Stocks
Below are short closing comments as well as some info ahead of tomorrow’s USDA report which should help stages for fundamental price direction.
Today corn closed down 9 cents on the old crop, new crop was off a nickel, Beans where up 11 on old crop, new crop up 9, KC wheat was off 5, MPLS wheat was down 2 on the nearby while deferred slots where weaker, and CBOT wheat was down a dime. Outside markets where mixed with the equities firmer for 6th session in a row, crude was down, the US dollar is off with the Juen at 76.33, and European wheat was down 1.50-2.00 %.
The market traded today like what has been in the news lately or leading the headlines and that is that we saw the market play the hand that they feel beans will have a supportive report and corn a negative report. Only time will tell and my bias is that even if we have a negative report the only way we really see extended pressure is if the USDA throws out numbers on the stocks report that are so high that they say it doesn’t matter how many acres we have. I.E. I feel there are too many what if’s in regards to weather, acres, demand, etc to see grain just fall off of a cliff unless we see a number in the stocks that indicates we don’t need an acre battle.
Charts do look a little scary and really have set the stages to see tomorrow’s movement provide direction as most charts have condsolidated near support type areas that should either hold and provide another leg up or if broken indicate that much more downside is quite possible. The other factors besides our supply and demand fundamentals will also play a big role; lately one of the biggest the US dollar has started to gain a little upside traction. Will we see the dollar put in a bottom or should I say have we seen the dollar put in a bottom that could tie in with grains having made a top or is the price action in the dollar that of a corrective nature before more lows which would tie into the grains bouncing?
For risk management sake don’t be afraid to use the tools that are out there to help protect yourself as we really never know what will happen; that only thing we really have going for is right now is the fact that we are at profitable levels and a break probably still gives one a chance to sell profitable levels come tomorrow. The other thing we have or should have going for us is seasonal tendencies; that we usually rally during uncertain times like planting and early growing seasons.
Basis has been super firm on spring wheat so don’t forget to have your offers out there as things are hot and it is more freight related then anything.
Please give us a call if there is anything we can do for you.
Thanks
Tuesday, March 29, 2011
Nick Updates
Below are Nick updates as he tries various diagnol strategies to help protect ahead of report


Nick Closed April Positions
Nick closed all of his April positons at market value on Friday; below are how those numbers ended up; basically he
Tuesday, March 22, 2011
Nick update on a rain filled day in central South Dakota
I have been meaning to update Nick; but to be honest with the recent market movements and the rather knee jerk reaction decisions he made in his marketing plan last week I have been a little scaried to.
Last week he added trades that simply didn't make much sense in staying neutral as they where so one sided and they did do what he intended and that was stop the bleeding but they didn't play both sides nearly as much as he typically tries to.
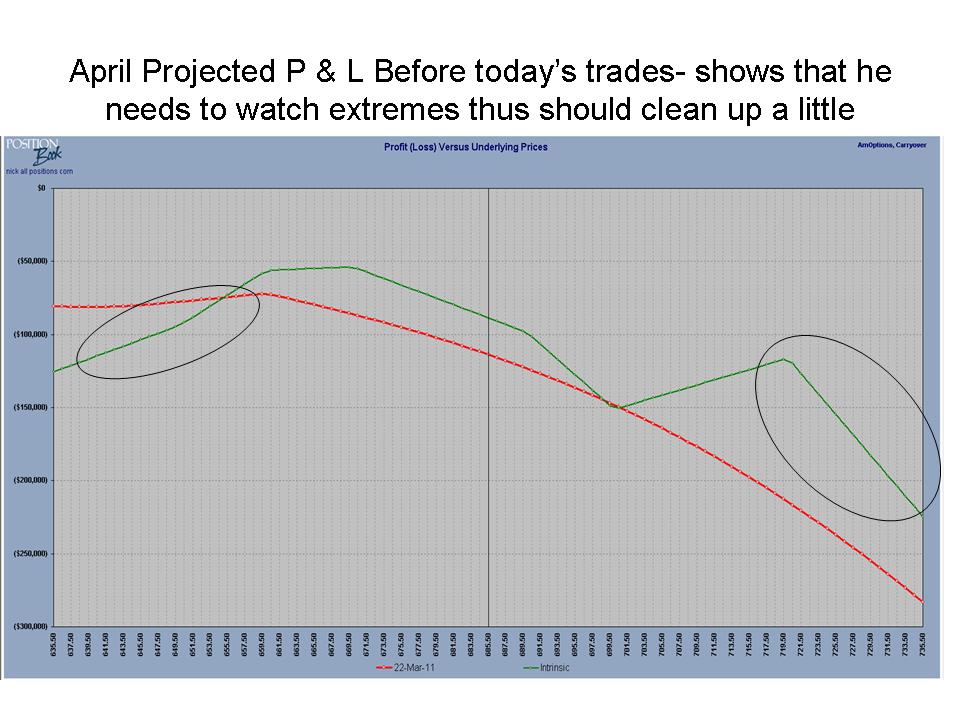
So today's his adjustments are more in line as to trades he should make; but he has let things get so out of hand that if he was real he would have probably had a heart attach from stress just from calls to his broker and from his bank. When all is said and done his outlook or picture looks great provided his interest expense which is an unknown doesn't bite him.
One does have to question how real it is or could be; as well as is it worth it. But the one thing he does have going is he know exactly where he will be when all of these options or insurance both written and purchased expire at the end of June. It is clear that at X price his account will be worth X.
Take a look and injoy; just please make sure to understand the risks that are associated with futures and options as they are not for everyone and past results don't gtd future results; plus his info is simply a mock character and makes no intention to be any type of recommendation. Call your broker if you want one of those.


Last week he added trades that simply didn't make much sense in staying neutral as they where so one sided and they did do what he intended and that was stop the bleeding but they didn't play both sides nearly as much as he typically tries to.
So today's his adjustments are more in line as to trades he should make; but he has let things get so out of hand that if he was real he would have probably had a heart attach from stress just from calls to his broker and from his bank. When all is said and done his outlook or picture looks great provided his interest expense which is an unknown doesn't bite him.
One does have to question how real it is or could be; as well as is it worth it. But the one thing he does have going is he know exactly where he will be when all of these options or insurance both written and purchased expire at the end of June. It is clear that at X price his account will be worth X.
Take a look and injoy; just please make sure to understand the risks that are associated with futures and options as they are not for everyone and past results don't gtd future results; plus his info is simply a mock character and makes no intention to be any type of recommendation. Call your broker if you want one of those.


Monday, March 21, 2011
July Corn Chart
Below are a couple of July corn charts............which price movement is the direction and which is the correction?


Grain Closing Comments start of week March 21st
Below are closing comments as well as a
forward from Brock With their Clear View and info from RJOMRT.com on US
In more choppy price action our grains closed the start of the week mixed; with old crop corn up 3, new crop corn was up 11, old crop beans where unchanged to up 2 cents, new crop beans where up 11, KC wheat was down 3 cents/bu, MPLS wheat was 2-3 better, CBOT wheat was down 2 on the nearby while deferred slots gained such as the July 2012 which was up 7 cents, the equities bounce with the DOW up 178 points pushing back above 12,000m the US dollar continued it’s weakness with the June Dollar at 75.685, and crude oil gained another dollar as it is now at 102.20 on the April contract.
All in all I am not sure what to make of the trading session today; it did seem a little quieter then what we seen last week; but it wouldn’t take much to tame that volatility as even though our markets where not as noisy today there was still plenty of price action as each of the big three (corn, wheat, and beans) saw at least 20 cent price ranges with a quarter being about the average price range.
To summarize the price action over the past several weeks I would say that just about that time one figured out what they thought would happen next was about the time the market said nope and did just the opposite. As corn and wheat where making their highs many had jumped on the bull bandwagon and if they had sold now was the time they where looking to re-own. Then many of those same participants jumped back on the go down bandwagon around the lows seen the middle of last week as in a heart beat the markets that looked like they wouldn’t ever stop free falling did a reversal without even a so much as a warning. The scary thing is we are seeing these choppy volatile markets even before the time when we should see them. During times of tight fundamentals or times when many decisions are made or simply during planting and growing season is when historically we see the type of price action we have seen lately happen. So what does that tell us as we go forward? It tells me that one shouldn’t even try to out guess the market and should focus on solid risk management with risk diversification that is bottom line focus thus allowing one to throw out a little of the noise here and there via having marketing objectives that are simply to achieve bottom line results that don’t have the stress and worry that other types of marketing styles may have.
That isn’t to say to have your blinders on to what is doing what in our markets and to why; it is more so trying to say not to get carried away in the headlines as at the end of the day fundamentals that where learned from Econ 101 in that high prices cure high prices as do low price cure low prices will rule out; it just sometimes is a matter of when and what levels are high and/or low.
Their was a reported sale of 116,000 tonnes sold to Unknown for this marketing year; many believe it is China; but some are mentioning that the # doesn’t fit with the number that China typically buys at.
Last week the CFTC showed the biggest increase in commercial position since April 2007; perhaps indicating that the break was very heavy bought via end users.
The biggest thing that the market should see is
Wednesday, March 16, 2011
Update on Grain Marketing Character Neutral Nick
Below is update for our grain market specialist Neutral Nick; who trys to stay hedged or sold 100,000 bushels worth of beans, corn, and wheat.
Nick the mock grain marketing character like many real world producers does have other stuff to do other then simply trying to out guess what the funds might do or not to do our market place on any given day.
He hasn't found the solution to knowing when and what the next black swan event will be or happen; but despite his many errors he has a good chance of having made good money in a very unique style of hedging grain/commodities. The style comes from the delta neutral concept and the fact that he always thought it made more sense to sell insurance versus spending money buying it.
Our markets have been a little up and down lately and Nick has really had to add plenty of positions which are not free of commissions to try and keep his ship floating. With the pressure seen last week and then the limit to nearly limit down moves seen yesterday his trade volume is simply increasing. So with his style he once again this week he found himself behind the eight ball in the chase for a return on his investment that was high enough to allow him to sleep like a baby. (Despite how some would view his risk-return ratio. )He might argue that threw mathamatics he is simpling trying to play the grain marketing and commoditiy trading game via futures and options as the house rather then the average joe walking down the street. Or as the insurance seller not the buyer.
Either way Nick has had some serious trades lately in some price action in our grain markets that should have many producers as well as other commericials wondering what will the funds and money flow do to my markets next and how am I positioned versus the various possible what if's that could happen as we move forward.

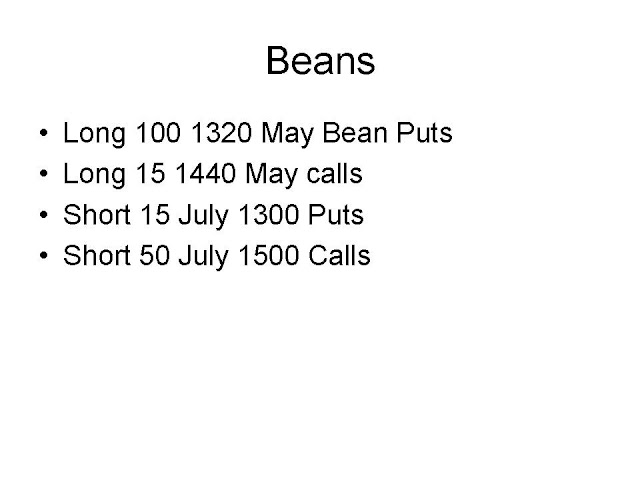
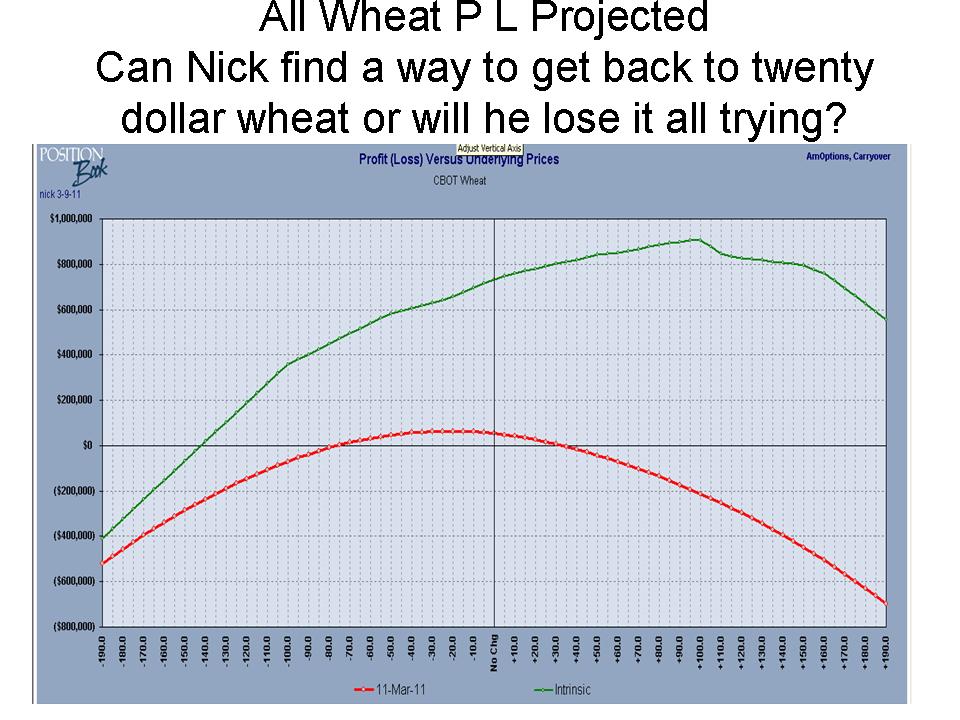
Here is what he did on wheat today to try and accomplish delta position equal to 100,000 bushels sold (hedged).
290 trades to adjust versus 20 to be short? Ouch those fee's do add up.

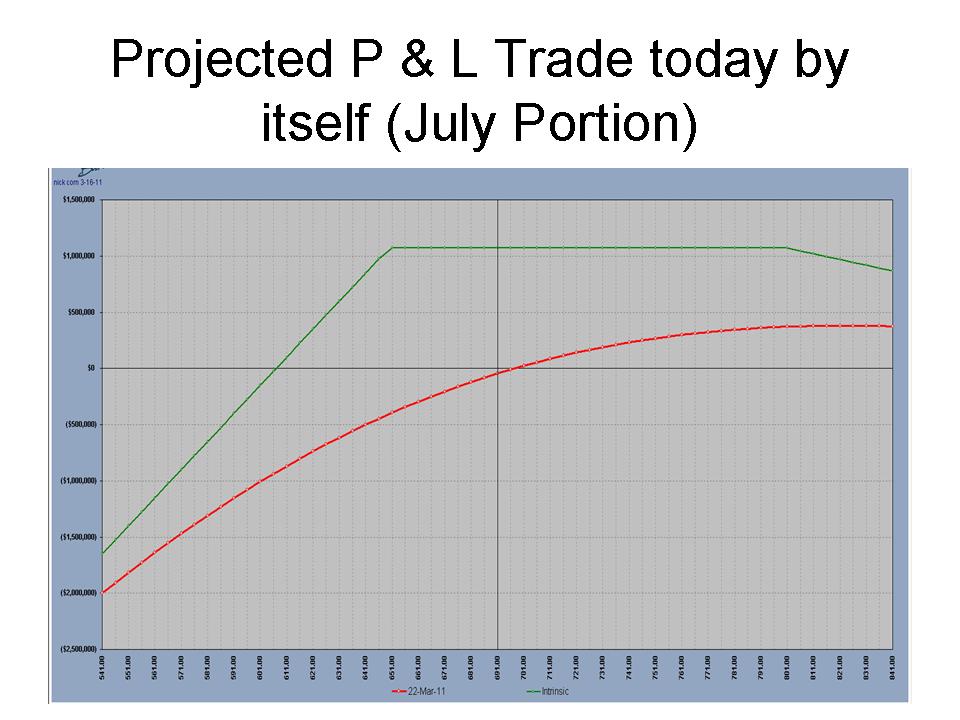
Below shows July positions; on 100,000 bushels sold not a bad chart; especially if his creative juices and help raise the green line threw time.


Today's trades in corn really help show his goal and objective. Simply move the green line up as much as possible in the areas that it has the most weakness or risk exposure but try to do so without losing it all if we change directions again.


Overall Nick is nervous as he can be; but isn't that what he wanted to have happen; basically sell fear of the sky falling and then sell the fear of inflation and concept that we have to continue to get higher.
His biggest comfort level lies within the fact that he likes what his bottom dollar line or profit ends up if things expire at or near these price levels.
For those thinking of trying a style like this please talk to your broker as trading futures and options is very risky; plus past results are not a gtd of future results.
Nick the mock grain marketing character like many real world producers does have other stuff to do other then simply trying to out guess what the funds might do or not to do our market place on any given day.
He hasn't found the solution to knowing when and what the next black swan event will be or happen; but despite his many errors he has a good chance of having made good money in a very unique style of hedging grain/commodities. The style comes from the delta neutral concept and the fact that he always thought it made more sense to sell insurance versus spending money buying it.
Our markets have been a little up and down lately and Nick has really had to add plenty of positions which are not free of commissions to try and keep his ship floating. With the pressure seen last week and then the limit to nearly limit down moves seen yesterday his trade volume is simply increasing. So with his style he once again this week he found himself behind the eight ball in the chase for a return on his investment that was high enough to allow him to sleep like a baby. (Despite how some would view his risk-return ratio. )He might argue that threw mathamatics he is simpling trying to play the grain marketing and commoditiy trading game via futures and options as the house rather then the average joe walking down the street. Or as the insurance seller not the buyer.
Either way Nick has had some serious trades lately in some price action in our grain markets that should have many producers as well as other commericials wondering what will the funds and money flow do to my markets next and how am I positioned versus the various possible what if's that could happen as we move forward.

Here is what he did on wheat today to try and accomplish delta position equal to 100,000 bushels sold (hedged).
290 trades to adjust versus 20 to be short? Ouch those fee's do add up.

Below shows July positions; on 100,000 bushels sold not a bad chart; especially if his creative juices and help raise the green line threw time.


Today's trades in corn really help show his goal and objective. Simply move the green line up as much as possible in the areas that it has the most weakness or risk exposure but try to do so without losing it all if we change directions again.


Overall Nick is nervous as he can be; but isn't that what he wanted to have happen; basically sell fear of the sky falling and then sell the fear of inflation and concept that we have to continue to get higher.
His biggest comfort level lies within the fact that he likes what his bottom dollar line or profit ends up if things expire at or near these price levels.
For those thinking of trying a style like this please talk to your broker as trading futures and options is very risky; plus past results are not a gtd of future results.
Monday, March 14, 2011
Grain Market Comments - Close Open Commodities for 3-14-2011 firmer markets for the grains despite weakness in the overnight session? Trend Reversal on the charts or a correction?
Below are grain market comments as well as a forward from K State from their webinar on Friday.
Our markets really got beat up last week as fund liquidation was heavy across the board; in the overnight session we traded both sides but finished under some pressure as corn ended the overnight session down about 5-6 cents, beans off 14-17 cents, KC wheat was down 5, MPLS wheat was down 10, and CBOT wheat was off 7 cents. As of 9:20 outside markets have European wheat down 3 %, the equities continue their pressure with the DOW down 55 points, crude oil is off about 60 cents a barrel, and the US dollar is under pressure with the March down 305 at 76.465.
Outside influences along with an overall attitude and outlook change for the grains was the main story last week and appears to be the story this a.m. as money flow has done a turn around here recently. The fundamentals or facts that we lack supply and have good to decent demand for our grains has took a back seat; at least it did last week. Nothing much really changed other then money flow over the past couple of weeks.
Ideas are still out there that we could run out of some of the grains or at least have very tight ending stocks whereas any delays in harvest or pick up in demand could really get things explosive when the marketing year comes to an end. Corn, soybeans, and sunflowers are the main three grains in our area that have the potential to see some fireworks if see things really stay tight.
Our markets did open up under pressure this a.m. but turned back to the positive early in the morning; as of about 12:30 both corn and wheat have had about a 20 cent trading range since 9:30 with the markets very near the middle of that range with corn, CBOT wheat, KC wheat, and nearby beans all plus or minus 1-2 cents of unchanged. MPLS wheat is lagging as it is down 5 presently. The equity markets are still down with the DOW off about 120 points, 30 off of its lows. While crude is down 80 cents which is nearly 2.00 off of it’s low point.
So far a little mixed emotions as to what today’s market is trying to tell us; I do like the fact that so far we have held Friday’s lows in most of the markets and we have had some long tailed candles on the charts which is a sign of a little indecision; i.e. perhaps we are trying to form some sort of bottom?
The big thing that will continue to give us direction will be money flow and if it wants to flow out there is tremendous downside risk; especially if there ends up being any negative fundamental changes. The other big thing and in my opinion what will end up telling us if we have 4.00 ish corn or 8.00-10.00 ish corn will be and is weather. Stories are out there in regards to the KC crop and its outlook. Bottom line is we are a long way away from having grown any crops as we haven’t even planted them so in theory we should see more of that risk premium come back into our marketplace especially as our demand and underlying fundamentals stay strong.
The money flow and fundamentals probably continue to give us a great deal of volatility as we move forward and that will probably lead to many buying and selling opportunities as the funds seem to help our markets really over do market pricing moves; both directions; as to which direction could be next to get over done keep in an eye open to how they are sitting as when too many starting leaning one side or another it can mean a trend reversal or a correction is near.
Basis for spring wheat remains firm; but much of that is due to freight and protein spreads. Railroads are behind and product isn’t able to move as fast as it would like to be moved. Us an elevator seem to be stuck in the middle as farmers are not able to get as much hauled as they would like and buyers can’t get the product like they would like to either. It is normal to see freight and movement slow in the winter; but this is as bad as I have ever seen it and it does spill over a concern or yellow flag if you will when I think about what the March USDA balance sheet will show. Is it possible that the slow movement via our infrastructure for moving grains has slowed down so much that the March stocks number comes in higher then expected and leads to surprises in the balance sheet in the form of more grain inventory?
We did have grain export inspections out this a.m. wheat came in at 25.7 million bushels as it continues to lag the paced needed to hit current projections; presently that number is about 30 million.
Corn shipments also lagged as they came in at 35.2 million bushels which is about 6 million bushels shy of what is needed on a per week basis to meet current projections.
Beans did have strong shipments at 32.9 which is nearly 2 ½ - 3 times what is needed on a per week basis to meet current projections. Perhaps the strong shipments in beans help make sense of the slow shipments in the other grains as I know that our elevator can only handle so much threw it.
Friday, March 11, 2011
Nick update - Charts - Strategies trading Dec corn (Marketing 2011 new crop corn strategy comparison)
Below is a bunch of info; first is an update on our grain marketing character who uses delta based hedging; in attempts to stay hedged 100,000 bushels of each corn, winter wheat, and soybeans. Then we have a handful of updated grain charts with ideas on support and resistance levels as well as my thoughts on what the charts maybe trying to tell us about the future direction of grains and commodities. There is also some info on comparing a couple grain marketing strategies and showing profit and loss graphs in an attempt to determine which trading strategy or grain marketing strategy has the best risk/reward.


Subscribe to:
Posts (Atom)