Showing posts with label Trade Comparison. Show all posts
Showing posts with label Trade Comparison. Show all posts
Tuesday, February 8, 2011


Tuesday, February 1, 2011
Comparison of a Couple Trades
I read a blog today that had some info on sales strategies that one might consider (DTN's market matter blog); I left my comments on some of the things I seen with the marketing possiblities and wanted to compare a couple possible strategies in the eyes of a producer.
So i compared two strategies; one was the sale of a 7.20 Dec corn call; along with the purchase of a Dec 5.80 corn put and the other strategy was the sale of a 7.50 Dec call along with the purchase of a 6.50-6.00 bear put spread. I did these comparisons based on when the options expire and I used the close of Feb 1st to try and compare what net a producer would recieve. So I calculated the gains and losses plus where futures to give a net recieved via a producer using such a hedge.
Below the pink line is the 3-leg trade of buying a 6.50-6.00 bear put spread while selling the 7.50 call in terms of what the producer would receive for his hedge gains or losses at experation provided he sold the grain on at the same time the options expire. The green/blue line is what a producer would recieve via selling the above mentioned call and purchasing the above mentioned put.
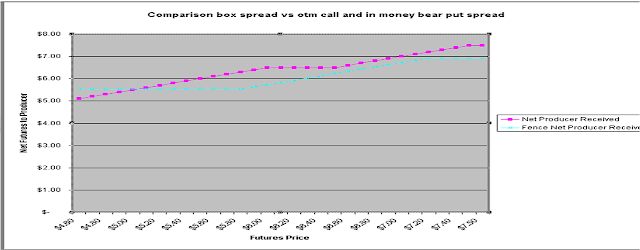
The above helps show the benefits of both of the trades; simply put the 3 leg trade adds to a producers bottom line and leaves a little more upside then the other trade does. They both have caps or a max net price that a producer will receive. The draw back of the 3 leg trade versus selling of a call to help pay for just a put is the fact that the producer doesn't have complete coverage; which is shown on the right side of the graph when the pink line starts losing versus the green line.
So to summarize 5.00 ish or better the 3 leg trade nets more and in some cases quite a bit more; whereas the 2 leg trade provides much more downside protection if the market falls out of bed.
Other things to keep in mind would be margin requirements, flexiblity (i.e. is it easier to get out of or adjust a 3 leg trade or a two leg trade), and understanding of how the options will be priced or valued before experation based on what if factors.
The reason I prefer the 3 leg trade over the other would be probablity of the trade it self. In that if are unchanged the trade simply add's 50 cents to my bottom line and actually add's to one's bottom line all the way up to about a 50 cent rally. Logic says that markets can go three ways; up, down, or sideways. The three leg trade doesn't do enough on a down market; as nothing really does; but it can be a winning trade if the market is going up, going down, or simply trades sideways; while the other when looked at as a trade via it self can lose in all three of those markets as it will never add to one's bottom line in an up or sideway's market.
So i compared two strategies; one was the sale of a 7.20 Dec corn call; along with the purchase of a Dec 5.80 corn put and the other strategy was the sale of a 7.50 Dec call along with the purchase of a 6.50-6.00 bear put spread. I did these comparisons based on when the options expire and I used the close of Feb 1st to try and compare what net a producer would recieve. So I calculated the gains and losses plus where futures to give a net recieved via a producer using such a hedge.
Below the pink line is the 3-leg trade of buying a 6.50-6.00 bear put spread while selling the 7.50 call in terms of what the producer would receive for his hedge gains or losses at experation provided he sold the grain on at the same time the options expire. The green/blue line is what a producer would recieve via selling the above mentioned call and purchasing the above mentioned put.

The above helps show the benefits of both of the trades; simply put the 3 leg trade adds to a producers bottom line and leaves a little more upside then the other trade does. They both have caps or a max net price that a producer will receive. The draw back of the 3 leg trade versus selling of a call to help pay for just a put is the fact that the producer doesn't have complete coverage; which is shown on the right side of the graph when the pink line starts losing versus the green line.
So to summarize 5.00 ish or better the 3 leg trade nets more and in some cases quite a bit more; whereas the 2 leg trade provides much more downside protection if the market falls out of bed.
Other things to keep in mind would be margin requirements, flexiblity (i.e. is it easier to get out of or adjust a 3 leg trade or a two leg trade), and understanding of how the options will be priced or valued before experation based on what if factors.
The reason I prefer the 3 leg trade over the other would be probablity of the trade it self. In that if are unchanged the trade simply add's 50 cents to my bottom line and actually add's to one's bottom line all the way up to about a 50 cent rally. Logic says that markets can go three ways; up, down, or sideways. The three leg trade doesn't do enough on a down market; as nothing really does; but it can be a winning trade if the market is going up, going down, or simply trades sideways; while the other when looked at as a trade via it self can lose in all three of those markets as it will never add to one's bottom line in an up or sideway's market.
Saturday, January 22, 2011
Trade Comparison
Lots of times many ask what type of trades or moves should one make given XYZ circumstance. In the world of commodity futures and options there are so many variables it is tough to know what the right decision is at any given time.
The thing one is suppose to do when deciding how to trade, hedge, or market one's grain is the risk-reward and benefits-drawbacks both known, known that is unknown, and the unknown unknows.
I am not going to attempt to cover any of that; nor will I got into other facets that are very important such as cash flow management.
What I have been working on is a spreadsheet showing trade comparisons. (Part of the reason I am working on it is my wife is going to build me a viynl replica of the graph showing the trade comparisons so I can have the info on my office.)
I am still working out some kinks before I distribute the excell spreadsheet. I do have many strategies listed and for the graph below I used July corn and the option closes from 1-21-11.
Because of the many different trades I have broke the graph up a little bit in an effort to keep the noise down a little on it.
Here are the options used in this comparison
Here is a quick run down of some of the trades and the expected return at expiration based on X Price. Keep in mind July futures are at 6.71; also this doesn't look at net to a producer; this is net of a trade by itself.
Keep in mind that as producers your generically speaking on's net worth simply follows the long futures line; in that if we go up in price you make more money and if we go down you lose money; so all long or short futures should run at a 45% angle if a graph is centered.
This first graph is meant to try and show comparisons between straight long and other trades that are simliar in manner. Such as a replacement trade as well as long calls and short puts.

I will be adding some more comparisons as I do have them set up on spreadsheet; but for now and thinking in terms of grain markeitng I am looking to compare ownship methods. So if a producer is unsold or basic long futures do any of the above trades look to have a better risk reward profile then the simply long futures?
Sell cash and go long a call looks like it has a little less risk; but it will be impossible to get the same upside as simply staying long.
The generic play I like is one that should tie into basis sales; i.e. times of a great basis the re-ownership strategy has benefits over the straight long futures. I would refer to the sale of a put and purchase of a call, calls spreads all act similar to what a futures contract does. If one sells a put and the market goes up your now short put is worth less in value; while if we go up calls and call spreads should appreciate in value (minus the time decay and other greeks that help determine an options value.)
You can see above that the green line out performs the straight long futures contract rather well until we get above the short call at which point this trade becomes capped.
The thing one is suppose to do when deciding how to trade, hedge, or market one's grain is the risk-reward and benefits-drawbacks both known, known that is unknown, and the unknown unknows.
I am not going to attempt to cover any of that; nor will I got into other facets that are very important such as cash flow management.
What I have been working on is a spreadsheet showing trade comparisons. (Part of the reason I am working on it is my wife is going to build me a viynl replica of the graph showing the trade comparisons so I can have the info on my office.)
I am still working out some kinks before I distribute the excell spreadsheet. I do have many strategies listed and for the graph below I used July corn and the option closes from 1-21-11.
Because of the many different trades I have broke the graph up a little bit in an effort to keep the noise down a little on it.
Here are the options used in this comparison
| Strike | Cost | |
| FUTURES | $ 6.71 | $ - |
| ATM PUT | $ 6.70 | $ 0.69 |
| ATM CALL | $ 6.70 | $ 0.70 |
| OTM PUT | $ 5.50 | $ 0.18 |
| OTM CALL | $ 7.70 | $ 0.39 |
| Deep OTM CALL | $ 9.00 | $ 0.17 |
Here is a quick run down of some of the trades and the expected return at expiration based on X Price. Keep in mind July futures are at 6.71; also this doesn't look at net to a producer; this is net of a trade by itself.
Keep in mind that as producers your generically speaking on's net worth simply follows the long futures line; in that if we go up in price you make more money and if we go down you lose money; so all long or short futures should run at a 45% angle if a graph is centered.
This first graph is meant to try and show comparisons between straight long and other trades that are simliar in manner. Such as a replacement trade as well as long calls and short puts.

I will be adding some more comparisons as I do have them set up on spreadsheet; but for now and thinking in terms of grain markeitng I am looking to compare ownship methods. So if a producer is unsold or basic long futures do any of the above trades look to have a better risk reward profile then the simply long futures?
Sell cash and go long a call looks like it has a little less risk; but it will be impossible to get the same upside as simply staying long.
The generic play I like is one that should tie into basis sales; i.e. times of a great basis the re-ownership strategy has benefits over the straight long futures. I would refer to the sale of a put and purchase of a call, calls spreads all act similar to what a futures contract does. If one sells a put and the market goes up your now short put is worth less in value; while if we go up calls and call spreads should appreciate in value (minus the time decay and other greeks that help determine an options value.)
You can see above that the green line out performs the straight long futures contract rather well until we get above the short call at which point this trade becomes capped.
Subscribe to:
Posts (Atom)